
Page 23 - qp_17
P. 23
Functional sensitivity is the analytes concentration at which it meets the precision that is
required for the measurements. It takes into account precision and not bias or total Error.
D) Procedure for calculation of Functional sensitivity
Example: The manufacturer’s claim for functional sensitivity for Troponin I at CV of 10 % is
0.032ug/L.
1. Select patient’s sample with at least 5 different concentrations covering below and above
the manufacturer’s functional sensitivity claimed value. Do serial dilutions, if there are
difficulties in findings patient’s samples at those levels.
2. Run a minimum of 20 replicates over several days for each sample.
3. Calculate mean, SD and CV for each sample.
4. Plot the graph with the CV obtained against the concentration of the analyte.
5. Draw a line at CV of 10% and check the corresponding concentration of the analyte.
This is the functional sensitivity value for the analyte.
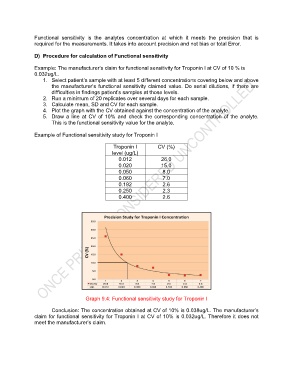
Example of Functional sensitivity study for Troponin I
Troponin I CV (%)
level (ug/L)
0.012 26.0
0.020 15.0
0.050 8.0
0.060 7.0
0.192 2.6
0.250 2.3
0.400 2.6
Graph 9.4: Functional sensitivity study for Troponin I
Conclusion: The concentration obtained at CV of 10% is 0.038ug/L. The manufacturer’s
claim for functional sensitivity for Troponin I at CV of 10% is 0.032ug/L. Therefore it does not
meet the manufacturer’s claim.